Employing Site Analytics

Discovering Web Analytics Basics
Web analytics involves taking the information you glean from all your research and sitting down, looking at it, and figuring out what it all means. Bear with us: This can get a little tricky because the terms are so similar. In order to figure out web analytics, you need to know the two different sets of numbers you’re looking at — web metrics numbers and web analytics numbers.
Web metrics
Web metrics is the measurement of what’s happening on the Internet itself. It’s focusing on the number and types of people online, the number of broadband versus dial‐up connections, advertisers, advertisements (shapes, sizes, level of annoyance), and all things related to the Internet as a whole.
People
The first kind of company that tracks web metrics data does so by using large panels of people whom the companies follow while they surf the Internet as part of their daily routine. These companies report which sites are the most popular and can have their panels check out your competitors and do a comparative analysis.
Hits
The second type of web metrics firm checks out the hits on the ISPs (Internet service providers). These firms are watching the masses out there surfing on the Internet.
Responsiveness
A third type of web metrics firm watches the responsiveness of popular websites. They track how well a popular entertainment site holds up during the Oscars or the Emmys or if sports sites can handle the traffic during the Super Bowl, and which ones run the fastest and which ones drown under the increased demand.
Web analytics
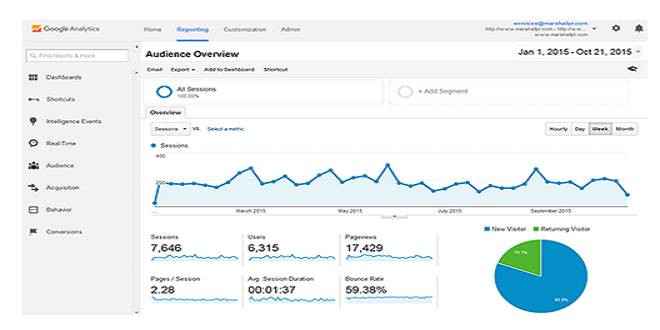
On a smaller but no less important scale is web analytics, which concerns itself with the particulars of a single website, instead of the entire web. The people who do web analytics are looking at how successful your site is in attracting the kind of visitors who bring you conversions. Visitors who convert do whatever your website is asking of them: make a purchase, sign up for a newsletter, watch your videos, and so on. Using web analytics means looking beyond just finding out where you rank or how many people clicked over from the search engine listing and actually checking to see how many visitors came to your site and provided you a conversion.
Measuring Your Success
Say that you have a website that specializes in classic‐car customization services. The first thing you want to do is measure the amount of sales generated on your site. That’s easy enough — but other activities need recording as well. Other activities you can record include email newsletter signups, file downloads, RSS subscriptions (news feeds that automatically show updates to a site that offers one), and user account creation.
Identifying what you’re tracking
In order to start analyzing whether your website is doing what it needs to be doing, you have to acquire a sample of data. This sample allows you to extract a baseline report of data on your users.
Types of data vary from site to site. A data sample from an e‐commerce site reads differently than a sample from a political newsletter. For websites that aren’t impacted by seasonal trends (meaning they see a spike in business around a certain time of year), a three‐month sample is a great baseline range to work with. After you’ve determined what your baseline sample is (if you have seasonal trends, take a sample from your busy and slow periods), start recording numerical and trended data for analysis.
Free4Talk offers a unique platform for language learners to practice speaking skills. It’s easy to use and accessible. Users can connect globally, enhancing their fluency and confidence. Start your language journey with Free4Talk today. It’s a valuable tool for anyone looking to improve their language abilities.
Last word
You need to separate these two types of results because it can skew your data and throw off proper analysis. You have to understand how subtleties in an SEO program, like descriptions in a listing or movement in a SERP (search engine results page), can impact your traffic and productivity.


