Mastering SEO Tools and Reports

Getting Started with Conversion Testing
Say that you’ve gathered your data and done the proper analysis, and now you’ve decided that some things need to be changed on your website. Making major overhauls to your site requires A/B testing. A/B testing is testing the original version of the website (Version A) against the one you made the major changes to (Version B). The A/B test is a tool that tells you which changes have a better effect and to what degree.
Getting ready to run a conversion test
You can use any of several different tools to run a test on pages of your website and compare which variation sees better conversions. Google Analytics has a feature for running A/B tests and multivariate tests (which are like an A/B test except that they test smaller details, like a different font color, instead of large changes, and you can test all variables at once with different permutations). In this section, we outline the broad steps you have to take before you run a test.
The first thing you need to do before running your test is to choose your test page. Not every single page needs to have a test run on it: You probably don’t care about conversions from your About Us page, for example. To be a good candidate for testing, the page needs to offer an action the user can take, like purchasing, downloading, or signing up for something. The action can be as simple as a link that you want your users to click on — the point is that it has to be a measureable response
Discovering Page and Site Analysis Tools
Without wisdom, data is just numbers. To use the powerful analytics tools at your disposal, you first need to know what you want your website visitors to do. This can be anything from purchasing products to signing up for a newsletter or just getting more traffic to your website. After you know what you are measuring, you can view how well you’re doing in your analytics software.
Google Analytics is the free analytics package that we recommend using to see how your visitors are coming to your site and what they’re doing after they get there. With Google Analytics, you can segment your view of visitors by where they came from; those segments are paid and organic Google search results, social networks, and other special campaigns that the website owner may define.
To see your organic search traffic from both Bing and Yahoo, you look to the analytics reporting that’s part of the free Bing Webmaster Tools. You can see your paid search traffic from the combined Yahoo and Bing ad networks in Bing Ads Reporting.
Viewing performance of paid search campaigns
When you run a pay per click (PPC) campaign, you spend money whenever potential clients click your advertisement. Because you’re spending money, you want to know how much money or value you’re getting back for that campaign. That’s where PPC conversion reports come in.
Measuring traffic and conversion from organic search
Measuring how much of your traffic and conversion is from organic (non‐ paid) search is important because it tells you how much traffic and money you are getting for your SEO efforts. Every SEO campaign costs you time and money, so you want to know what you’re getting back for it. Most analytics software packages come with an out‐of‐the‐box report for getting traffic from organic search.
Last word
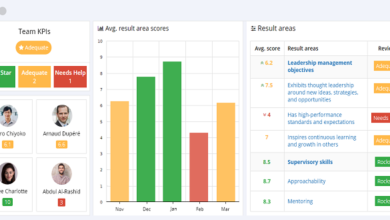
Both types of reports can be found in almost every analytics suite. The line graph has been set to the Bounce Rate metric and shows how often a visitor leaves after viewing only one page. In the table below the graph, you can see the bounce rate and exit rate of the pages listed. Examining these metrics on a page‐by‐page level can help you strengthen the weak points in your conversion funnel.


